Dynamic Requirements Report with Pivot Table
Learn how to export a dynamic HTML report for advanced data analysis using a pivot table or a pivot chart.
The ReqView exporter is a powerful feature that allows you to have full control over the data export process. You can customize export templates to output a requirements document into a static file with a structured text data format (HTML, XML, CSV, ...) which presents data in a chosen layout (e.g. table or book) and enables visual styling (inline CSS).
The exporter can even evaluate simple expressions during the export process, which gives you the ability to include calculations, rules checking, or custom counters in your export template, see Expression Helpers documentation section.
These data export capabilities cover the most needs of data reports. Let’s take a look at some more advanced data analysis reports, such as a pivot table.
Data Analysis in MS Excel
MS Excel is a very powerful data analysis tool and can also be used with data exported from ReqView into CSV.
You can simply prepare an Excel sheet with a PivotTable, export your ReqView document into a CSV file and connect the Excel sheet to the exported CSV file as an external data source, see Export to CSV documentation section.
The disadvantage of this approach is that not all users have Excel installed or know how to analyze data in Excel.
Dynamic HTML Reports
In this post we present a better approach for creating advanced data analysis reports, which takes the power of ReqView custom export templates one step further — custom export template outputs a custom data model which is dynamically processed and visualized using 3rd party Javascript data analysis libraries (such as D3.js).
This approach has the following advantages compared to data analysis in Excel:
- you do not need to install any other SW, just open reports in any modern web browser (Chrome, Firefox, Edge, Safari)
- you can easily integrate reports into project web pages or Wikis
- you can generate and update reports automatically by running ReqView Export CLI
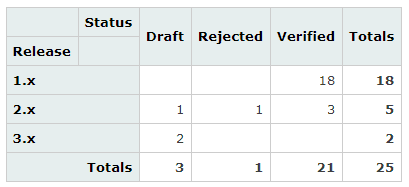
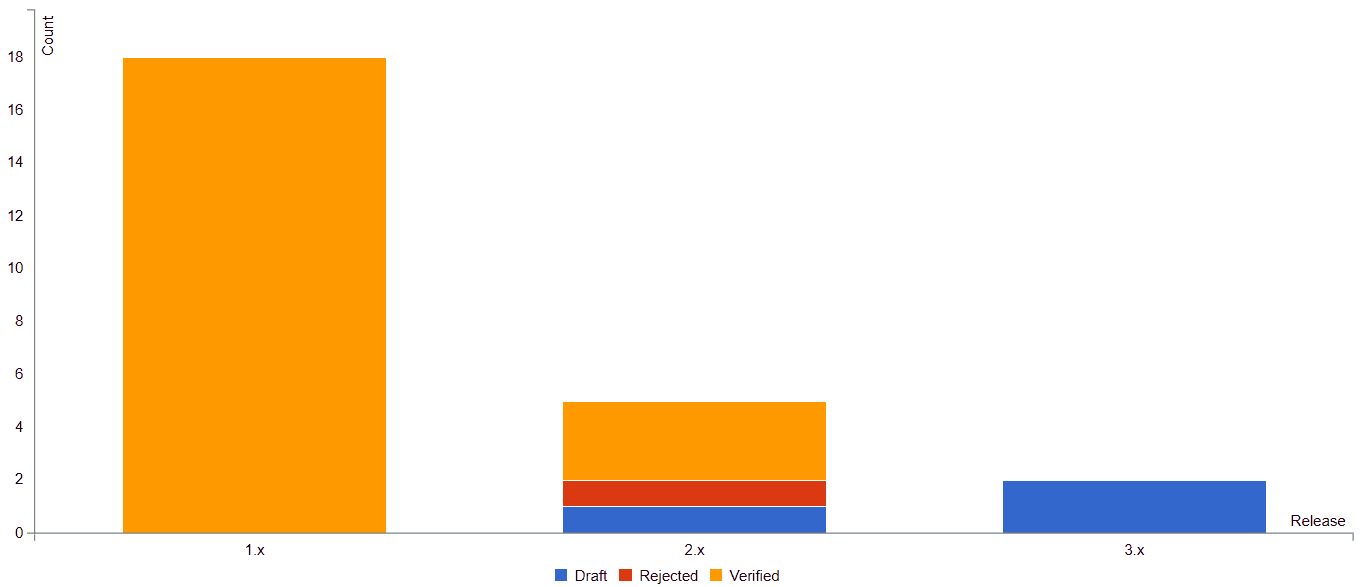
Let’s explain this approach on an example dynamic HTML report with a pivot table that sums the count of user stories with a given state for each release.
Preparing Data for Export
As the first step, you need to setup the analyzed data in the ReqView document being exported. In our example, we need to set release and status attributes for each user story.
You can get an example document for data analysis as follows:
-
Open the Example Project.
-
Switch to NEEDS document and open Document Attributes dialog (by Project > Document Attributes menu) to define the release attribute:
{...,"release": {"name": "Release","type": "enum","values": [{ "key": "1.x" },{ "key": "2.x" },{ "key": "3.x" }]}} -
Filter user stories by [Type: User Story] filter condition and set values in Release and Status columns as needed:
![Dynamic export filter Dynamic export filter]()
Dynamic HTML Export Template
You can download the example dynamic export template explained below here. It consists of the following 5 parts:
-
Loading of 3rd party libraries C3.js, D3.js, jQuery and PivotTable.js
-
Styling — customize lines and colors of the displayed chart
-
Exporting the data model — use
eachDocumentObjectexport template to generate JSON array of objects havingId,Status,TypeandReleaseproperties stored in global variabledata:var data = [{Id: ,Status: "" || "Unknown",Type: "" || "Unassigned",Release: "" || "Backlog"}] -
Setup dynamic components representing the pivot table and chart (see PivotTable.js Documentation):
$(function() {$("#table").pivot(data, {rows: ["Release"],cols: ["Status"],filter: filterUserStories});$("#chart").pivot(data, {cols: ["Release"],rows: ["Status"],renderer: renderers["Stacked Bar Chart"],filter: filterUserStories});});function filterUserStories(rowObj) {return rowObj["Type"] === "STORY"}Note that the
filterUserStoriescustom function is used to filter only user story records. -
Create DOM nodes storing the pivot table and chart:
<strong>Pivot Table:</strong><div id="table" style="margin: 30px;"></div><strong>Pivot Chart:</strong><div id="chart" style="margin: 30px;"></div>
Export the Dynamic HTML Report
You can export the HTML report in ReqView as follows:
- Switch to ReqView NEEDS document.
- Select File > Export > Custom Template menu to open the HTML Export Options dialog.
- In the system folder picker dialog, select the destination folder that will store the exported file NEEDS.html .
If you open the exported file NEEDS.html (download link) in your browser it will display the pivot table and chart:
Pivot Table

Pivot Chart

Conclusion
In this post we have explained how to export data from a ReqView document as a dynamic HTML report using 3rd party Javascript libraries for pivot table data analysis. The big advantage of this approach is that you can integrate the report in your project web pages or Wikis or just open it in a web browser.
This approach can be easily extended for other data analysis use cases, for instance, checking custom rules for common requirement errors. We will explain that in another blog post.
